How the AUD Gold Price Works
The Australian dollar gold price is not just the international gold price with a currency conversion applied. It is a product of two independent moving variables: the USD gold price and the AUD/USD exchange rate.
When the USD gold price rises, the AUD price rises proportionally, assuming the exchange rate is flat. But the exchange rate rarely stays flat during major market events. The AUD tends to fall sharply against the USD during financial crises, risk-off periods, and commodity price downturns. This is because the AUD is a commodity currency: it weakens when global growth fears rise, which is often the same environment that pushes gold higher in USD terms.
The result is a double amplification effect for Australian investors during crises. USD gold rises. AUD falls. Both move favourably for Australian gold holders at the same time. This is one of the most compelling structural arguments for holding gold in Australian dollars.
Track the live AUD gold spot price on our gold price page.
2000 to 2008: The Long Bull Market Begins
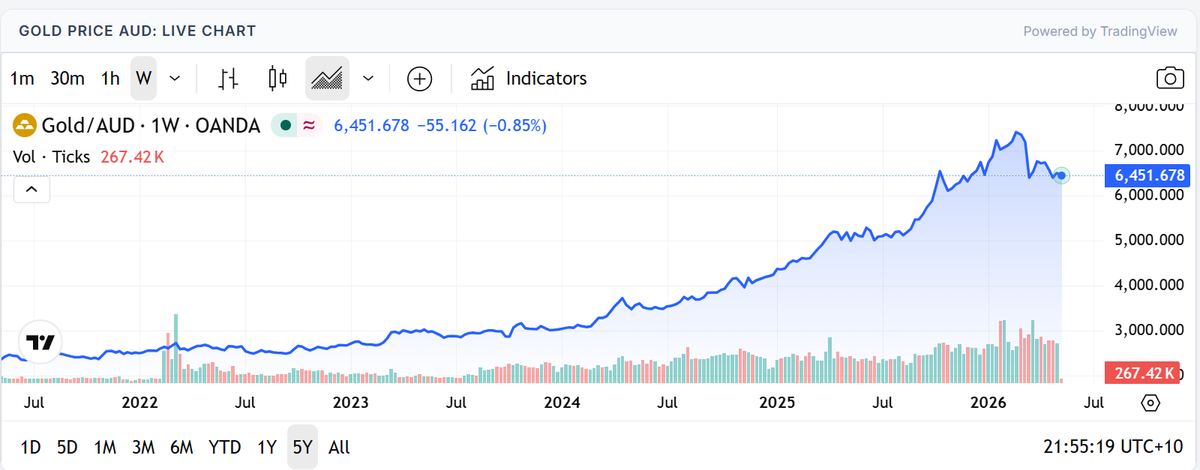
In January 2000, gold was priced at approximately A$480 per troy ounce. By the end of 2007, it had reached approximately A$900. The rise was steady rather than dramatic, driven primarily by USD gold moving from US$280 to US$840 over the same period.
The Australian dollar was relatively strong through much of this period, recovering from its 2001 low of US$0.48 to above US$0.90 by 2007. This meant Australian investors captured the USD gold rise but in a partially offsetting way: strong AUD dampened the AUD gold price gain.
Gold's performance in this period was strong but not yet dramatic. The bigger moves were coming.
2008 to 2012: The Financial Crisis Era
The 2008 global financial crisis was the event that demonstrated gold's AUD amplification effect most clearly. When Lehman Brothers collapsed in September 2008, the AUD/USD fell sharply from above US$0.95 to below US$0.60 within weeks, a collapse of over 35%.
USD gold also rose, but the AUD gold price moved even more dramatically. From approximately A$1,000 in mid-2008, AUD gold rose to A$1,700 by early 2009, a 70% rise in six months.
The subsequent European debt crisis and loose monetary policy globally drove gold to its USD peak of US$1,900 in September 2011. The AUD gold price reached approximately A$1,800 in the same period, as the AUD had by then recovered to near parity with the USD. This period established physical gold as a serious portfolio asset for Australian investors who had previously overlooked it.
2013 to 2019: Consolidation and the Long Wait
From its 2011 peak, gold fell sharply as the USD strengthened and global risk appetite recovered. By mid-2013, USD gold had fallen 25% from its peak. AUD gold fell less dramatically because the AUD also weakened over this period, partially offsetting the USD price decline.
Through 2013 to 2019, gold traded in a range of roughly A$1,500 to A$2,000 for most of the period. This was a test of investor patience. Buyers who entered at or near the 2011 peak had to hold through years of flat or declining returns before the next major move.
The lesson from this period: gold's long-run store of value function works over decades, not necessarily over any given 5-year period. Those who bought regularly throughout the flat years benefited from dollar cost averaging into lower prices.
2020: COVID-19 and the Biggest Single-Year Move
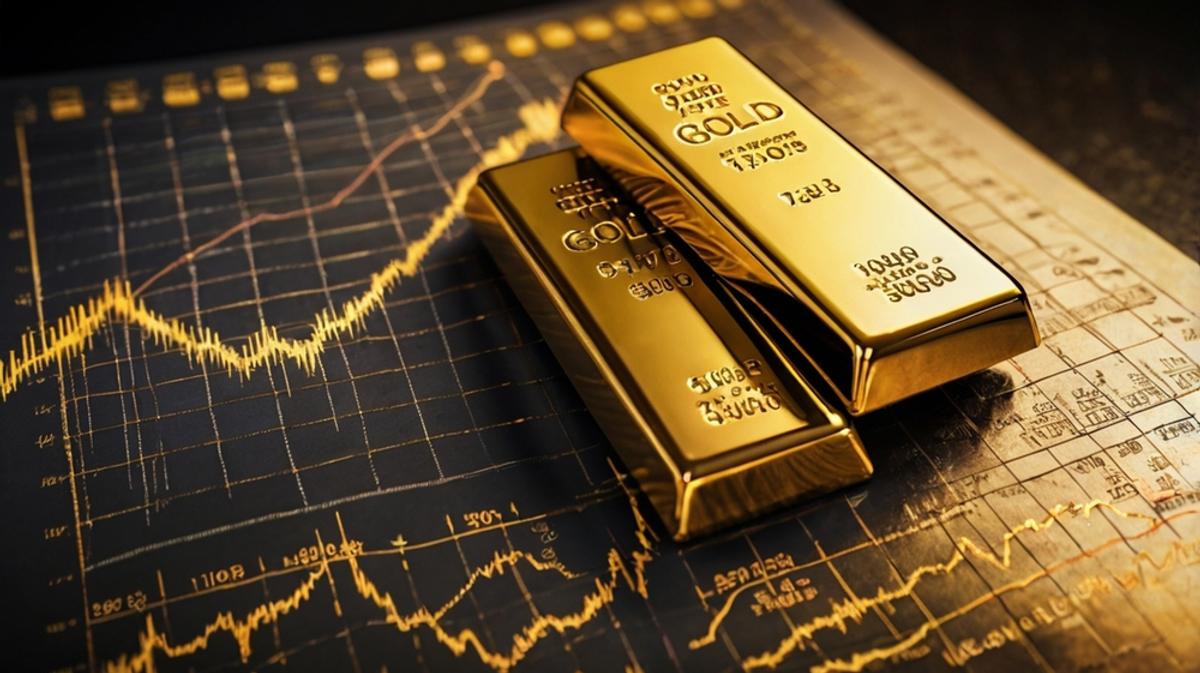
The COVID-19 pandemic in early 2020 triggered the most dramatic gold price move in the modern era for Australian investors.
In February 2020, as COVID-19 began spreading globally, the AUD fell sharply. By March, it had dropped below US$0.57. Simultaneously, USD gold was rising as investors sought safety. The combined effect drove AUD gold from approximately A$2,200 in January 2020 to A$2,900 by April, then to an all-time high above A$3,100 in August 2020, a gain of over 40% in eight months.
By 2026, AUD gold has continued its long-term upward trajectory, now trading well above A$5,000 per ounce and reaching above A$6,000 at various points. The structural case, driven by ongoing AUD weakness potential, high inflation, and global uncertainty, remains intact.
What Drives the AUD Gold Price: A Summary
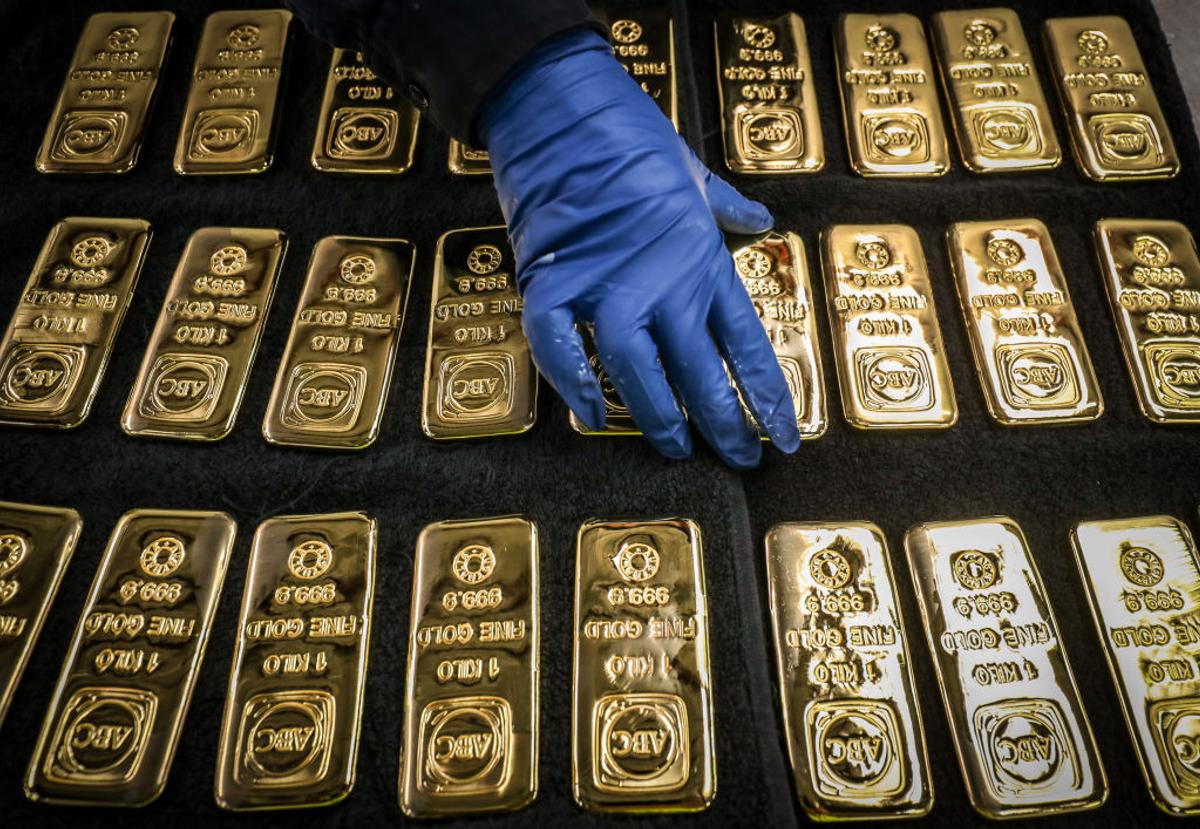
Four variables drive the AUD gold price, and understanding them helps you make better buying and selling decisions.
USD gold price: driven by US real interest rates, USD strength, global inflation expectations, central bank demand, and financial market stress. The primary long-run driver.
AUD/USD exchange rate: driven by Australian commodity export prices (particularly iron ore), RBA vs Fed interest rate differentials, and global risk sentiment. A weaker AUD amplifies gold's AUD return; a stronger AUD dampens it.
Supply and demand for physical gold: dealer premiums widen during high-demand periods (supply crunches), temporarily pushing actual purchase prices above spot.
AUD inflation: over long periods, the real return on gold is measured in inflation-adjusted terms. Gold has historically preserved purchasing power over multi-decade periods.
Use our gold price page to track the live AUD spot price and historical charts, and our premium calculator to model returns at different price scenarios.
Sources and Further Reading
Reserve Bank of Australia, AUD exchange rate historical data: rba.gov.au/statistics
World Gold Council, gold price history and investment research: gold.org
London Bullion Market Association, historical gold price data: lbma.org.uk
Australian Bureau of Statistics, CPI and inflation history: abs.gov.au
GoldSilverPrices.com.au: Live AUD gold spot price and dealer comparison